What is
Sticklac?
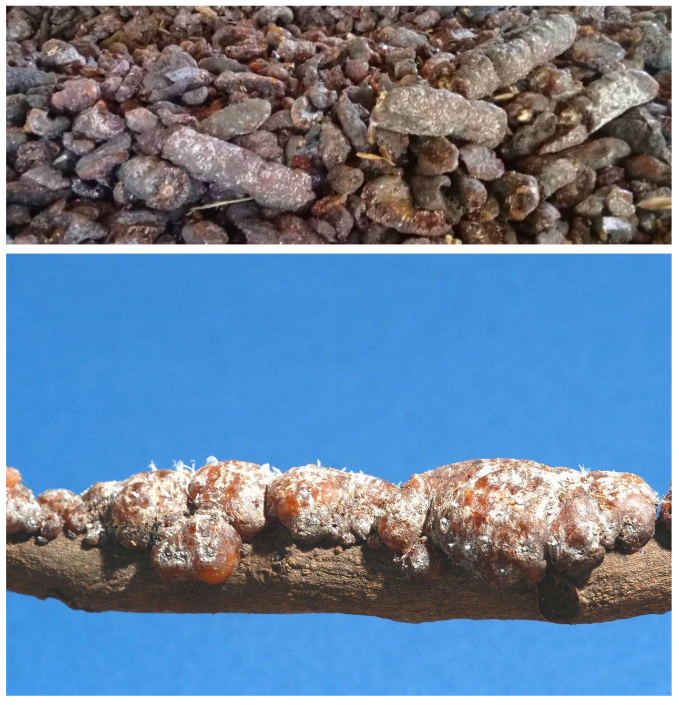
Sticklac (or “stick lac”) is the raw, crusty resin that lac insects (mainly Kerria lacca) secrete while feeding on host tree twigs. Harvesters cut the encrusted twigs and scrape off this resin; after crushing, sieving and washing, it becomes seedlac, and further refining yields shellac flakes. Lac also contains a natural red dye (“lac dye”). Wikipedia
What is it used for?
- Wood & instrument finishing / varnish (shellac): prized for quick drying, gloss, and repairability. Also used historically on lacquerware. Wikipedia
- Food & pharma glazing: refined lac (E904 “confectioner’s glaze”) coats candies, pills, and tablets. ams.usda.gov
- Dyeing: extraction of lac dye for reds/burgundies in textiles and craft work. Wikipedia
- Polishes, sealants, insulation & adhesives: valued for adhesion, moisture resistance, and forming smooth, non-toxic films. PMC
Where does it grow?
Lac production is centered in South, East and Southeast Asia. Major producers include India, Thailand, China, Bangladesh, Myanmar, Vietnam and Laos (with smaller pockets elsewhere, e.g., Mexico). Within India, production concentrates in states like Jharkhand, Chhattisgarh, West Bengal, and Maharashtra. Host trees include kusum (Schleichera oleosa), ber (Ziziphus mauritiana), dhak (Butea monosperma), rain tree (Albizia saman), and pigeon pea (Cajanus cajan). Wikipedia
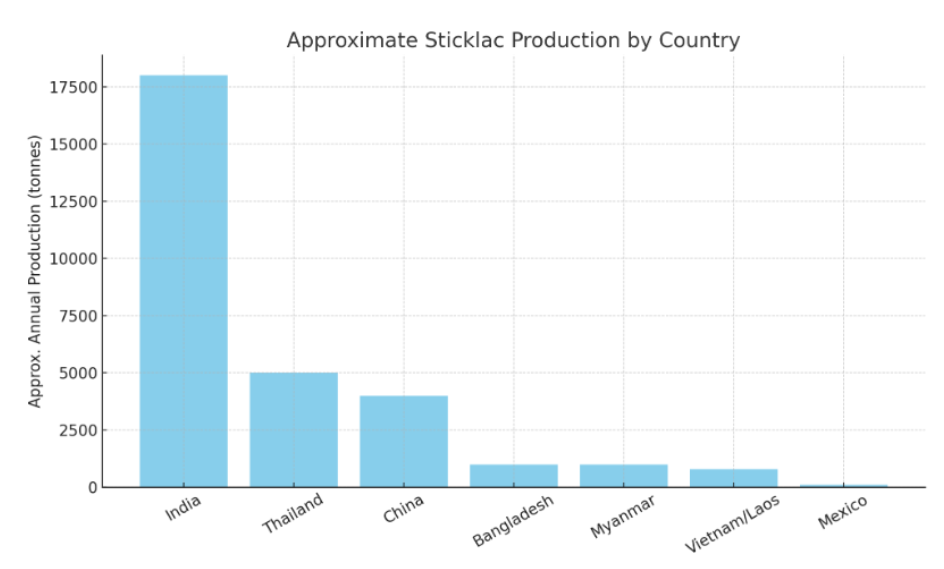
Approximate amounts by country
Reliable, up-to-the-minute lac statistics are sparse and vary by season, host tree, and market. The figures below synthesize recent Indian government/ICAR snapshots and well-cited historical ranges to give order-of-magnitude guidance (tonnes per year of lac products; values don’t sum neatly because sources/years differ):
| Country | Approx. annual production (t) | Notes |
| India | 14,000–19,000 | ICAR/IINRG compilations show ~14,230 t in 2017–18 and ~18,900 t in 2019–20. India is consistently the top producer. ResearchGatesdiopr.s3.ap-south-1.amazonaws.com |
| Thailand | ~4,000–7,000 | Historical exports in the 1990s were ~7,000 t (mainly seedlac); current output fluctuates and is likely lower but still significant. WikipediaNARINagriarticles.com |
| China | ~3,000–5,000 (sticklac) | 1990s data report 4,000–5,000 t sticklac and 2,000–3,000 t shellac from Yunnan/Fujian; modern totals vary. Wikipediaitj.dgciskol.gov.in |
| Bangladesh | hundreds to low thousands | Documented as a smaller but persistent producer within the regional cluster. Wikipedia |
| Myanmar | hundreds to low thousands | Part of the regional producing group; year-to-year swings are common. Wikipedia |
| Vietnam / Laos | hundreds to low thousands | Intermittent, often smallholder-based production. PMCWikipedia |
| Mexico (minor) | tens to low hundreds | Reported cultivation on Jatropha curcas; niche scale. Wikipedia |
For global scale, FAO’s classic overview cites ~20,000 t/year (all countries combined), while Indian sources often report India alone at ~17,000–21,000 t in certain years—illustrating how totals change with weather, pests, and market cycles. Treat the table as ballpark guidance, not strict accounting. FAOHomepradan.neticar.org.in
Sticklac Pricing Overview
- U.S. Wholesale Natural Lac (approximate range)
- $2.71 to $3.38 per kilogram (wholesale)
Equivalent to roughly $2,710 to $3,380 per metric ton.
Selina Wamucii
- $2.71 to $3.38 per kilogram (wholesale)
- Retail Prices in the U.S.
- $3.87 to $4.83 per kilogram (retail)
That translates to $3,870 to $4,830 per ton.
Selina Wamucii
- $3.87 to $4.83 per kilogram (retail)
- India: Retail Price Range
- $5.09 to $19.97 per kilogram retail.
That corresponds to $5,090 to $19,970 per ton.
In Indian Rupees: ₹421.87 to ₹1,654.89 per kg (~₹421,870 to ₹1,654,890 per ton)
Selina Wamucii
- $5.09 to $19.97 per kilogram retail.
- Thailand: Quote for Sticklac
- A supplier (DGP Supply Limited) listed “Sticklac Thailand origin” at USD 4,500 per ton, with a minimum order of 1 ton.
Freshdi
- A supplier (DGP Supply Limited) listed “Sticklac Thailand origin” at USD 4,500 per ton, with a minimum order of 1 ton.
- Other Mentions & Historical Context
- A 1991–92 FOA report noted an average f.o.b. (export) price of Indian lac at Rs 44.09 per kg, which would be about ₹44,090 per ton—though this is quite dated.
FAOHome
- A 1991–92 FOA report noted an average f.o.b. (export) price of Indian lac at Rs 44.09 per kg, which would be about ₹44,090 per ton—though this is quite dated.
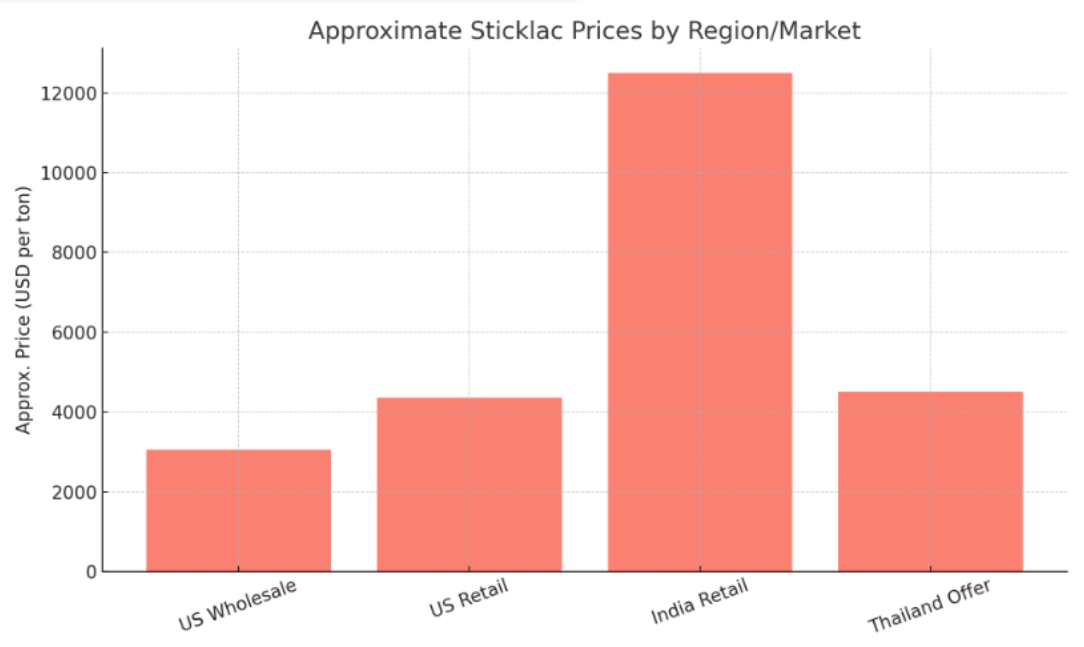
Price Summary Table
| Region / Type | Approx. ₹ (INR) per kg* | Approx. $ per ton |
| U.S. Wholesale | — | $2,710 – $3,380 per ton |
| U.S. Retail | — | $3,870 – $4,830 per ton |
| India (Retail) | ₹422 – ₹1,655 per kg | $5,090 – $19,970 per ton |
| Thailand (Offer) | — | ~$4,500 per ton (offer) |
Key Takeaways
- Wholesale lac prices tend to be in the $2,700–$3,400 per ton range.
- Retail lac prices can climb much higher—up to around $5,000–$20,000 per ton, especially in India.
- Thailand-specific offerings suggest a price point of about $4,500 per ton.
- Prices fluctuate widely depending on factors like purity, grade (sticklac vs seedlac vs shellac), regional supply, demand, and processing costs.
Live Sticklac / Natural Lac Price Data
- Selina Wamucii – Live U.S. Natural Lac Prices
- Retail range (USA): $3.87–$4.83 per kg (~$3,870–$4,830 per metric ton) Selina Wamucii
- Wholesale range (USA, 2025): $2.71–$3.38 per kg (~$2,710–$3,380 per ton) Selina Wamucii
- Historical trend: Wholesale export prices per kg dropped from about $3.76 (2017) to $3.08 (2021), with projections down to $2.68 (2024) Selina Wamucii
- 2. Selina Wamucii – Live Indian Natural Lac Prices
- Retail range (India): ₹421–₹1,655 per kg, or $5.09–$19.97 per kg (~$5,090–$19,970 per ton) Selina Wamucii
- Wholesale range (India, 2025): $3.56–$13.98 per kg (~$3,560–$13,980 per ton) Selina Wamucii
- Export trend: Declined at first, then rose from $7.51/kg (2014) to $9.44/kg (2020) Selina Wamucii
- 3. Vietnam Supplier Listing – Sticklac Resin
- Price: $7,000 per ton, with capacity-based packaging details (up to 12 tons per container) Essential Oil Vietnam
Summary Table: Live Price Comparison
| Region / Market | Price per kg (live range) | Approx. $ per ton |
| USA – Wholesale | $2.71 – $3.38 | $2,710 – $3,380 |
| USA – Retail | $3.87 – $4.83 | $3,870 – $4,830 |
| India – Wholesale | $3.56 – $13.98 | $3,560 – $13,980 |
| India – Retail | $5.09 – $19.97 | $5,090 – $19,970 |
| Vietnam Supplier | — | $7,000 (per listing) |
Interpretation and Insights
- USA markets offer relatively stable prices with wholesale around $2.7–$3.4/kg and retail up to $4.8/kg.
- Indian markets show greater variability—especially in the retail segment—as prices span a broad range tied to quality, local demand, and grade.
- The Vietnam supplier price of $7,000/ton aligns with some mid-range retail expectations, though it’s a single quoted offer.
Price Trends Over Time by Country / Market
United States (Export Prices)
- In 2017, export prices were approximately $3.76/kg
- By 2021, they had declined to around $3.08/kg
- This marks a drop of roughly 18.3% over that period.
- Forecasts project further decreases: $2.81/kg in 2023, and $2.68/kg in 2024
Selina Wamucii
Trend Insight: The U.S. natural lac export price has been on a steady downward trend, averaging around $3.45/kg over that span.
Germany (Export Prices)
- 2017: $11.95/kg
- 2021: Climbed to $15.20/kg
- 2022–2023: Performance stabilized; $15.17/kg in 2022, with projections at $15.17 (2023) and $15.18/kg (2024)
Selina Wamucii
Trend Insight: Germany saw a notable rise in export prices from ~2017 to 2021, followed by stable high pricing thereafter.
China (Export Prices)
- 2012: $7.63/kg
- 2013: Peaked at $12.56/kg
- 2014–2016: Decline, reaching a low of $6.35/kg (2016)
- 2017–2020: Gradual recovery—hovering between $6.80–$7.68/kg
- 2021: $9.01/kg
- 2022: $10.48/kg
- Forecasts: $11.05/kg (2023) and $11.62/kg (2024)
Selina Wamucii
Trend Insight: China’s export prices have been highly volatile, with early peaks and a dip mid-decade, followed by a resurgence and continued upward trajectory.
Myanmar (Export Prices)
Prices have fluctuated significantly:
- 2014: $0.50/kg
- 2016: Increased to $1.00/kg
- 2017: Jumped to $3.33/kg
- 2018: Fell back to $0.50/kg
- 2019: Rose to $2.46/kg
- 2020: Dropped to $2.06/kg
- 2021: Stood at $1.70/kg
- Projections suggest similar levels (~$1.70/kg) through 2024
Selina Wamucii
Trend Insight: Myanmar’s natural lac export price has been highly unstable, influenced perhaps by internal market conditions, supply fluctuations, or external constraints.
Myanmar (Export Prices)
A dramatic rollercoaster:
- 2014: $9.10/kg
- 2015: $8.01/kg
- 2017: $10.75/kg
- 2018: Surged to $21.66/kg
- 2019–2020: Crashed to $0.44/kg
- 2021: Held at $0.43/kg
- Forecast: Remains stable near $0.43/kg through 2024
Selina Wamucii
Trend Insight: Prices in Laos have seen extreme volatility, including one of the sharpest surges and collapses among regional producers.
Indonesia (Export Prices)
A relatively steady increase:
- 2017: $0.98/kg
- 2020: Slight dip to $1.02/kg
- 2021: $1.32/kg
- 2022: $1.45/kg
- Forecasts suggest $1.47/kg (2023) and $1.51/kg (2024)
Selina Wamucii
Trend Insight: Indonesia exhibits gradual, sustained growth in prices, with modest year-over-year increases.
Summary Table
| Country / Market | 2014–2017 Range | 2021 Price | Forecast 2023–2024 | Trend Summary |
| USA (export) | ~$3.76 → $3.08/kg | ~$3.08/kg | ~$2.68/kg | Steady decline |
| Germany (export) | ~$12/kg → $15/kg | ~$15.20/kg | ~$15.17–$15.18/kg | Rising, then stable high |
| China (export) | $7.6 → $6.3/kg dip | ~$9.0–$10.5/kg | ~$11–11.6/kg | Volatile early, strong upward trend |
| Myanmar (export) | $0.5 → $3.3/kg ups | ~$1.70/kg | ≈$1.70/kg | Large fluctuations, moderate later |
| Laos (export) | $8–$22/kg peak | ~$0.43/kg | ≈$0.43/kg | Extreme volatility, collapse |
| Indonesia (export) | ~$1.0 → $1.45/kg | ~$1.45/kg | ~$1.5/kg | Gradual rise |
Key Observations
- Mature markets (like the U.S. and Germany) show more predictable trends, though in very different directions—decline vs. stabilization at a higher level.
- Emerging producers (China, Myanmar, Laos, Indonesia) are notably more volatile. Laos stands out with extreme peaks and troughs, while Indonesia is the most consistent gradual riser.
- These patterns reflect how local factors—like climate events, political instability, or agricultural cycles—can significantly affect lac resin pricing.